
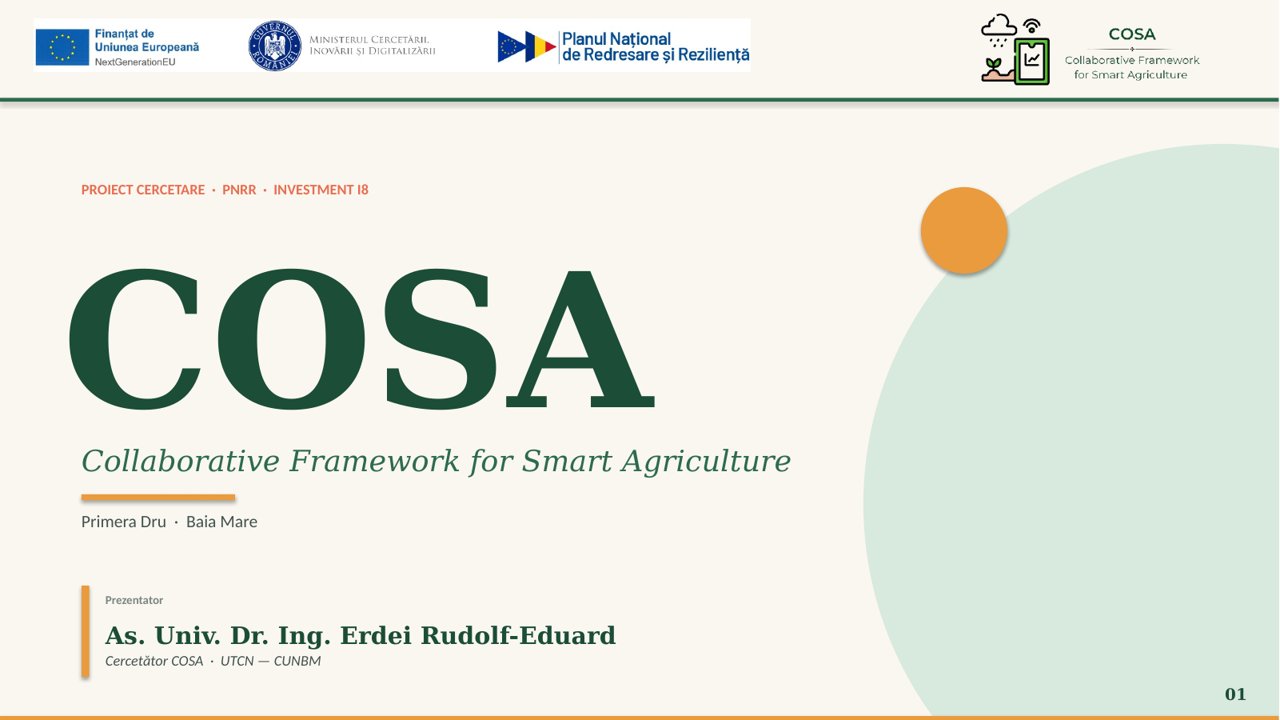
As. Univ. Dr. Eng. Rudolf Erdei, researcher in the COSA project at UTCN — CUNBM, opened Panel 2 with a synthesis of the project's technical results organised on three levels: national, regional and local.
Three levels of technical output
- Smart Specialization — GIS-based bonitation, satellite image processing and the AEGIS methodology for the intelligent economic specialisation of localities;
- AI Vision — automatic detection of plant diseases through deep learning models trained on close-up and aerial multispectral imagery;
- Smart Weather Station — an integrated assistant for farmers, combining environmental sensors with predictive analytics.
What smart specialization actually means
Smart specialisation is a strategic approach to regional development that orients regions toward their domains of excellence and competitive advantage, through targeted allocation of resources in the sectors with the highest potential. COSA operationalised this idea through the AEGIS methodology, which integrates seven complementary analytical layers — intrinsic economic specialisation, proximity contagion, value-chain dynamics, environmental indicators and more — to determine the optimal specialisation profile of each locality in Romania.
Visual results — propagation of innovation
Among the most striking visualisations presented were the contagion maps: heatmaps showing how the economic influence of one area propagates to its neighbours. Darker colours indicate stronger influence. The presentation showed proximity contagion at county level across Romania, illustrating how innovation and economic specialisation diffuse spatially.
The technical presentation built directly on the methods documented in the project's deliverable D3.2 — Distributed Data Analysis and Translation to Knowledge — and on the team's peer-reviewed publications on Markov chains and machine learning for the intrinsic economic specialisation of localities.
Presentation slides
View the full slide deck below — or open the PDF in a new tab / download.
If the PDF does not render in your browser, please use the "open" or "download" link above.

0 Comments